
This week, CMS updated their interactive Medicare Drug Spending Dashboard with data from 2015. The online tool provides users with Part B and Part D spending information for drugs with high spending on a per user basis, drugs with high overall spending, and drugs with large per unit cost increases. The tool returns relevant spending, utilization, and trend data as well as drug information, manufacturer, and uses in a user-friendly format.
Detailed methodology and the underlying data set are also available for download.
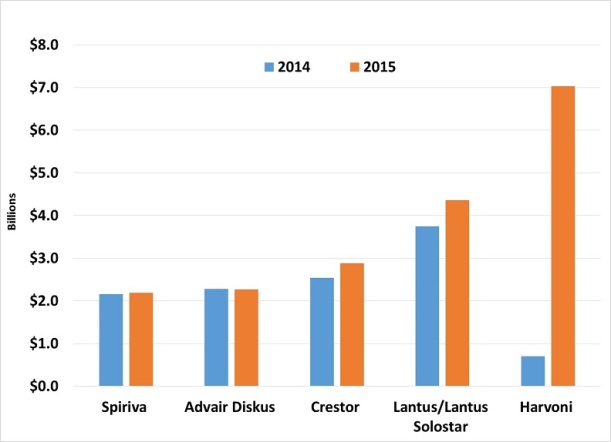
Part D Total Spending, Top 5 Drugs CY2015
Part D Dashboard Summary for CY2014 and CY2015
| # of Drug Products* | Total Program Spending | Percent of Program Spending | ||||
| 2014 | 2015 | 2014 | 2015 | 2014 | 2015 | |
| All Drugs | 3,761 | 3,812 | $121.5B | $137.4B | 100% | 100% |
| All Drugs with Total Program Spending >$250M | 115 | 119 | $76.7B | $88.0B | 63% | 64% |
| Top 15 Total Program | 15 | 15 | $29.1B | $35.6B | 24% | 26% |
| Spending Drugs | ||||||
| All Drugs with Annual Per-User Spending >$10K | 267 | 335 | $26.2B | $37.9B | 22% | 28% |
| Top 15 Drugs with Annual Per-User Spending >$10K | 15 | 15 | $9.3B | $9.2B | 8% | 7% |
| All Drugs with Unit Cost Increases >25% | 540 | 538 | $13.7B | $8.7B | 11% | 6% |
| Top 10 Drugs with Unit Cost Increases >25% | 10 | 10 | $1.3B | $1.4B | 1% | 1% |
| All Drugs Included in Dashboard | 40 | 40 | $39.7B | $46.2B | 33% | 34% |
* Drug Products defined by distinct Brand Name and Generic Name (First Databank), excluding over the counter drugs.

